

Campaigns - Daily Report
Overview
The "Campaigns - Daily Report" offers daily insights into key metrics such as clicks, impressions, and CTR, enabling users to make informed decisions for campaign optimization. By providing a daily breakdown, users can swiftly identify trends, compare campaign performance, and allocate resources effectively, resulting in continuous marketing improvement.
Navigating to the Campaigns - Daily
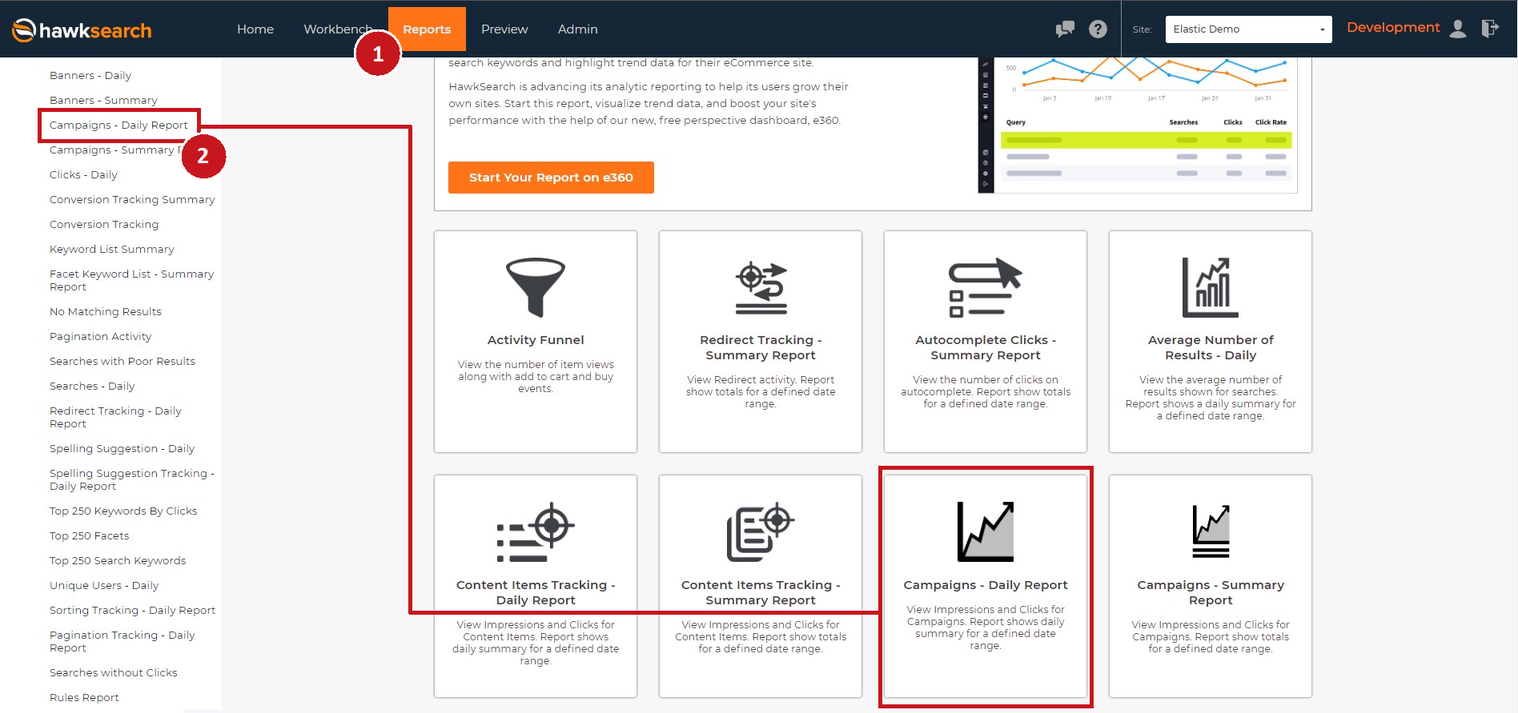
- To navigate to the Campaigns - Daily, click on “Reports“ from the top navigation
- Next, you can either select “Campaigns - Daily Report“ from the left navigation or select it from the Reports Home Page. Either link will take you to the Campaigns - Daily report page.
Customizing the Campaigns - Daily
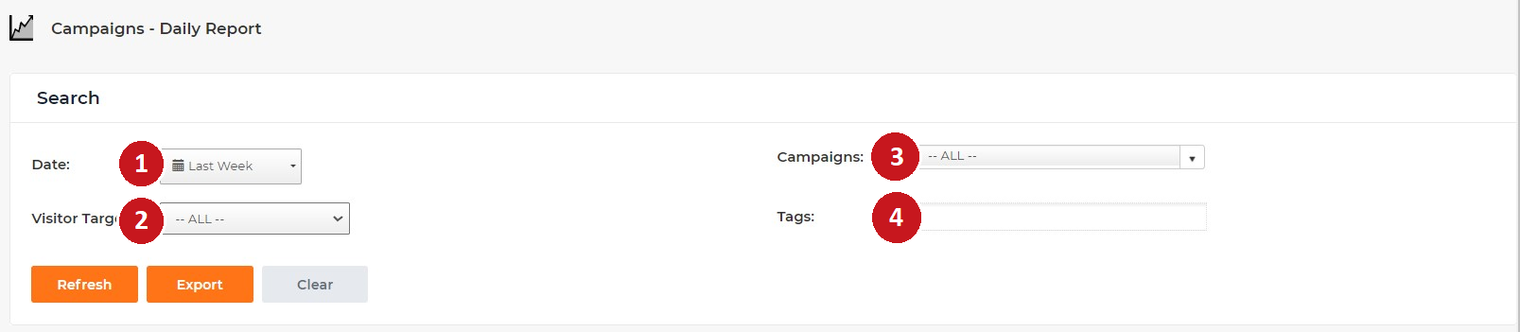
- Date: Select a date range of when to pull the data. There are several popular options included in the drop-down.
- --All--
- Last day
- Last 3 days
- Last Week
- Last 4 Weeks
- Last Month
- Last Year
- Other: Customized date range
- Visitor Targets: Use the drop down menu to select any of your visitor targets to display
- Campaigns: Use the drop down menu to select any of your campaigns to display
- Tags: Enter a campaign tag (or tags separated by commas) to narrow the scope of the report to a particular tag or set of tags
Additional Options
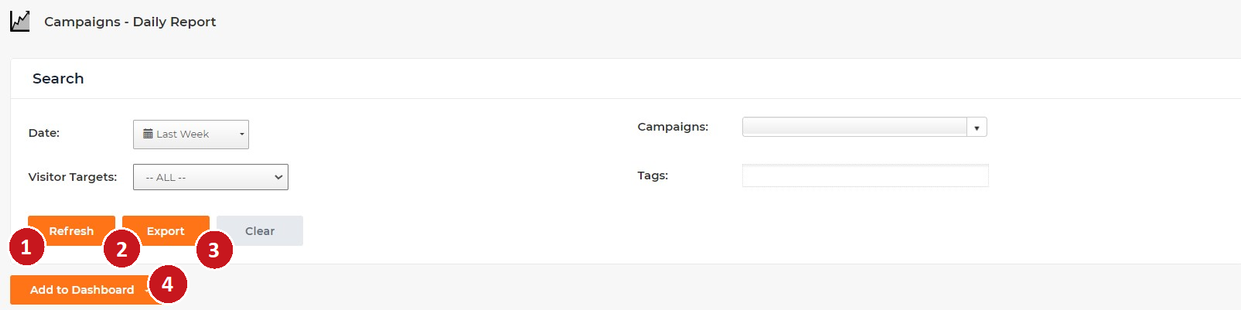
- Refresh: Clicking the "Refresh" button will cause the display of the reports to change according to your newest specifications.
- Export: To export the report to an excel document, click on the "Export" button.
- Clear: The "Clear" button will delete any changes that you have made.
- Add to Dashboard: Click this button to add a widget of this report to the Dashboard. You will have the options to add to any tabs that you have created on the Dashboard
Understanding Your Report
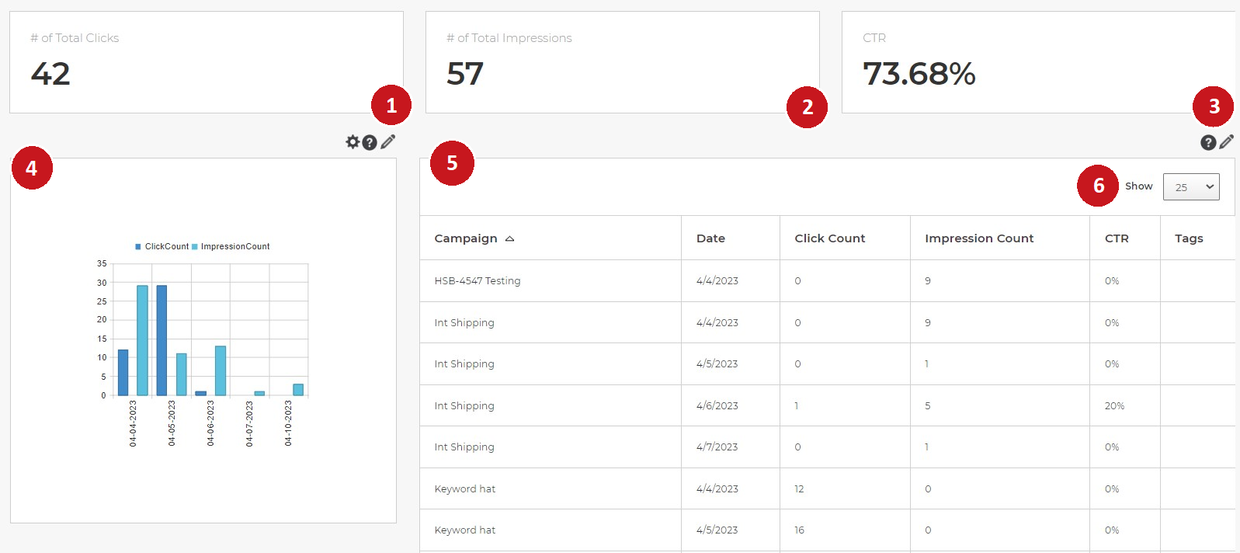
- Total Number of Clicks: The sum of the clicks in all the results that match the search criteria.
- Total Number of Impressions: The sum of the time that the campaign was displayed
- Total CTR: The total click-through-rate, calculated by dividing the total Click Count by the total Impression Count – this represents the percentage of users that clicked on the campaign after seeing it
- Bar Chart: The chart visually display daily performance of all the interacted campaigns over the selected time range.
- Table: The table shows the daily data of campaign’s performance
- Campaign: Name of the campaign that was interacted with
- Date: Date that the campaign was interacted with
- Click Count: Number of time that the campaign was clicked
- Impression Count: Number of time that the campaign was displayed
- CTR: The click-through-rate, calculated by dividing the Click Count by the Impression Count – this represents the percentage of users that clicked on the campaign after seeing it
- Tags: displays any tags that are stored with the campaign
- Results Included: Control how many campaigns are displayed on one page by using the “Show“ pull down menu.
- 25
- 50
- 100
Updated over 2 years ago
Did this page help you?