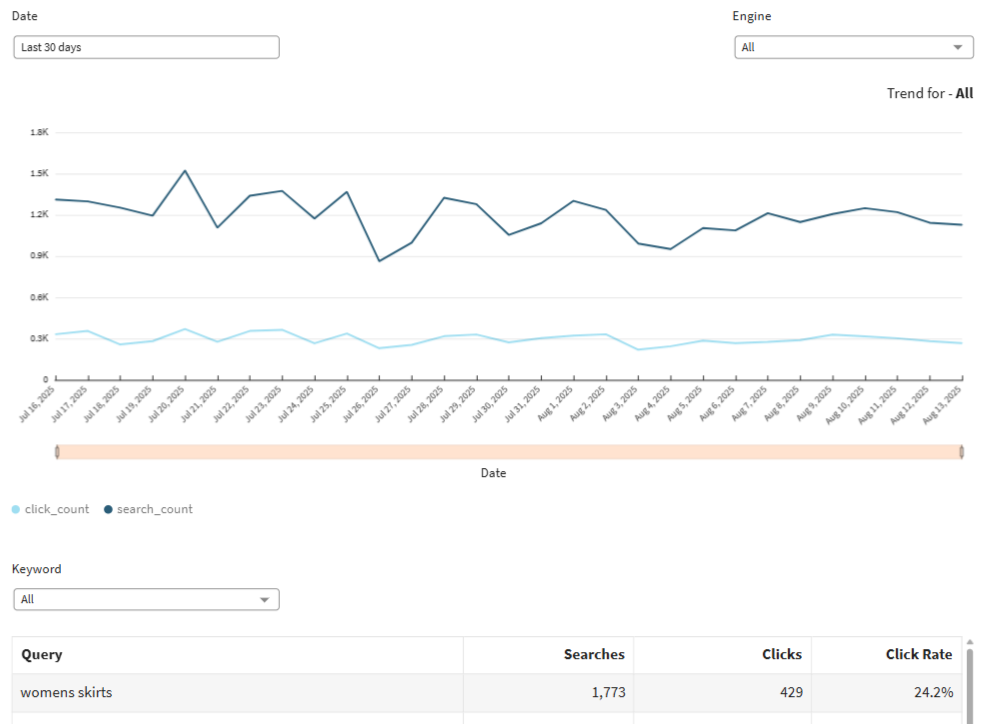
Top Queries

The "Top Queries" report provides an insightful snapshot of your search activity within a specified date range. It includes a dynamic line graph and a comprehensive table, allowing you to track and analyze search behavior. This report can help you with:

  1. Data-Driven Insights: Understand popular queries and their effectiveness to inform improvements in search functionality.
  2. Trend Analysis and Optimization: Visualize query trends to identify patterns and optimize the search experience.
  3. Content and User Experience Enhancement: Utilize common search queries to guide content strategy and boost user experience.


Please click on the table to visualize the trends of different query

  1. Query: Value of the query ‍
  2. Searches: Number of the times visitor searched for the query ‍
  3. Clicks: Number of the times visitor clicked on the query ‍
  4. Click Rate: Percentage of visitor that clicked on the query after searching it, this is calculated by dividing the Clicks by the Searches.