

Banner Performance
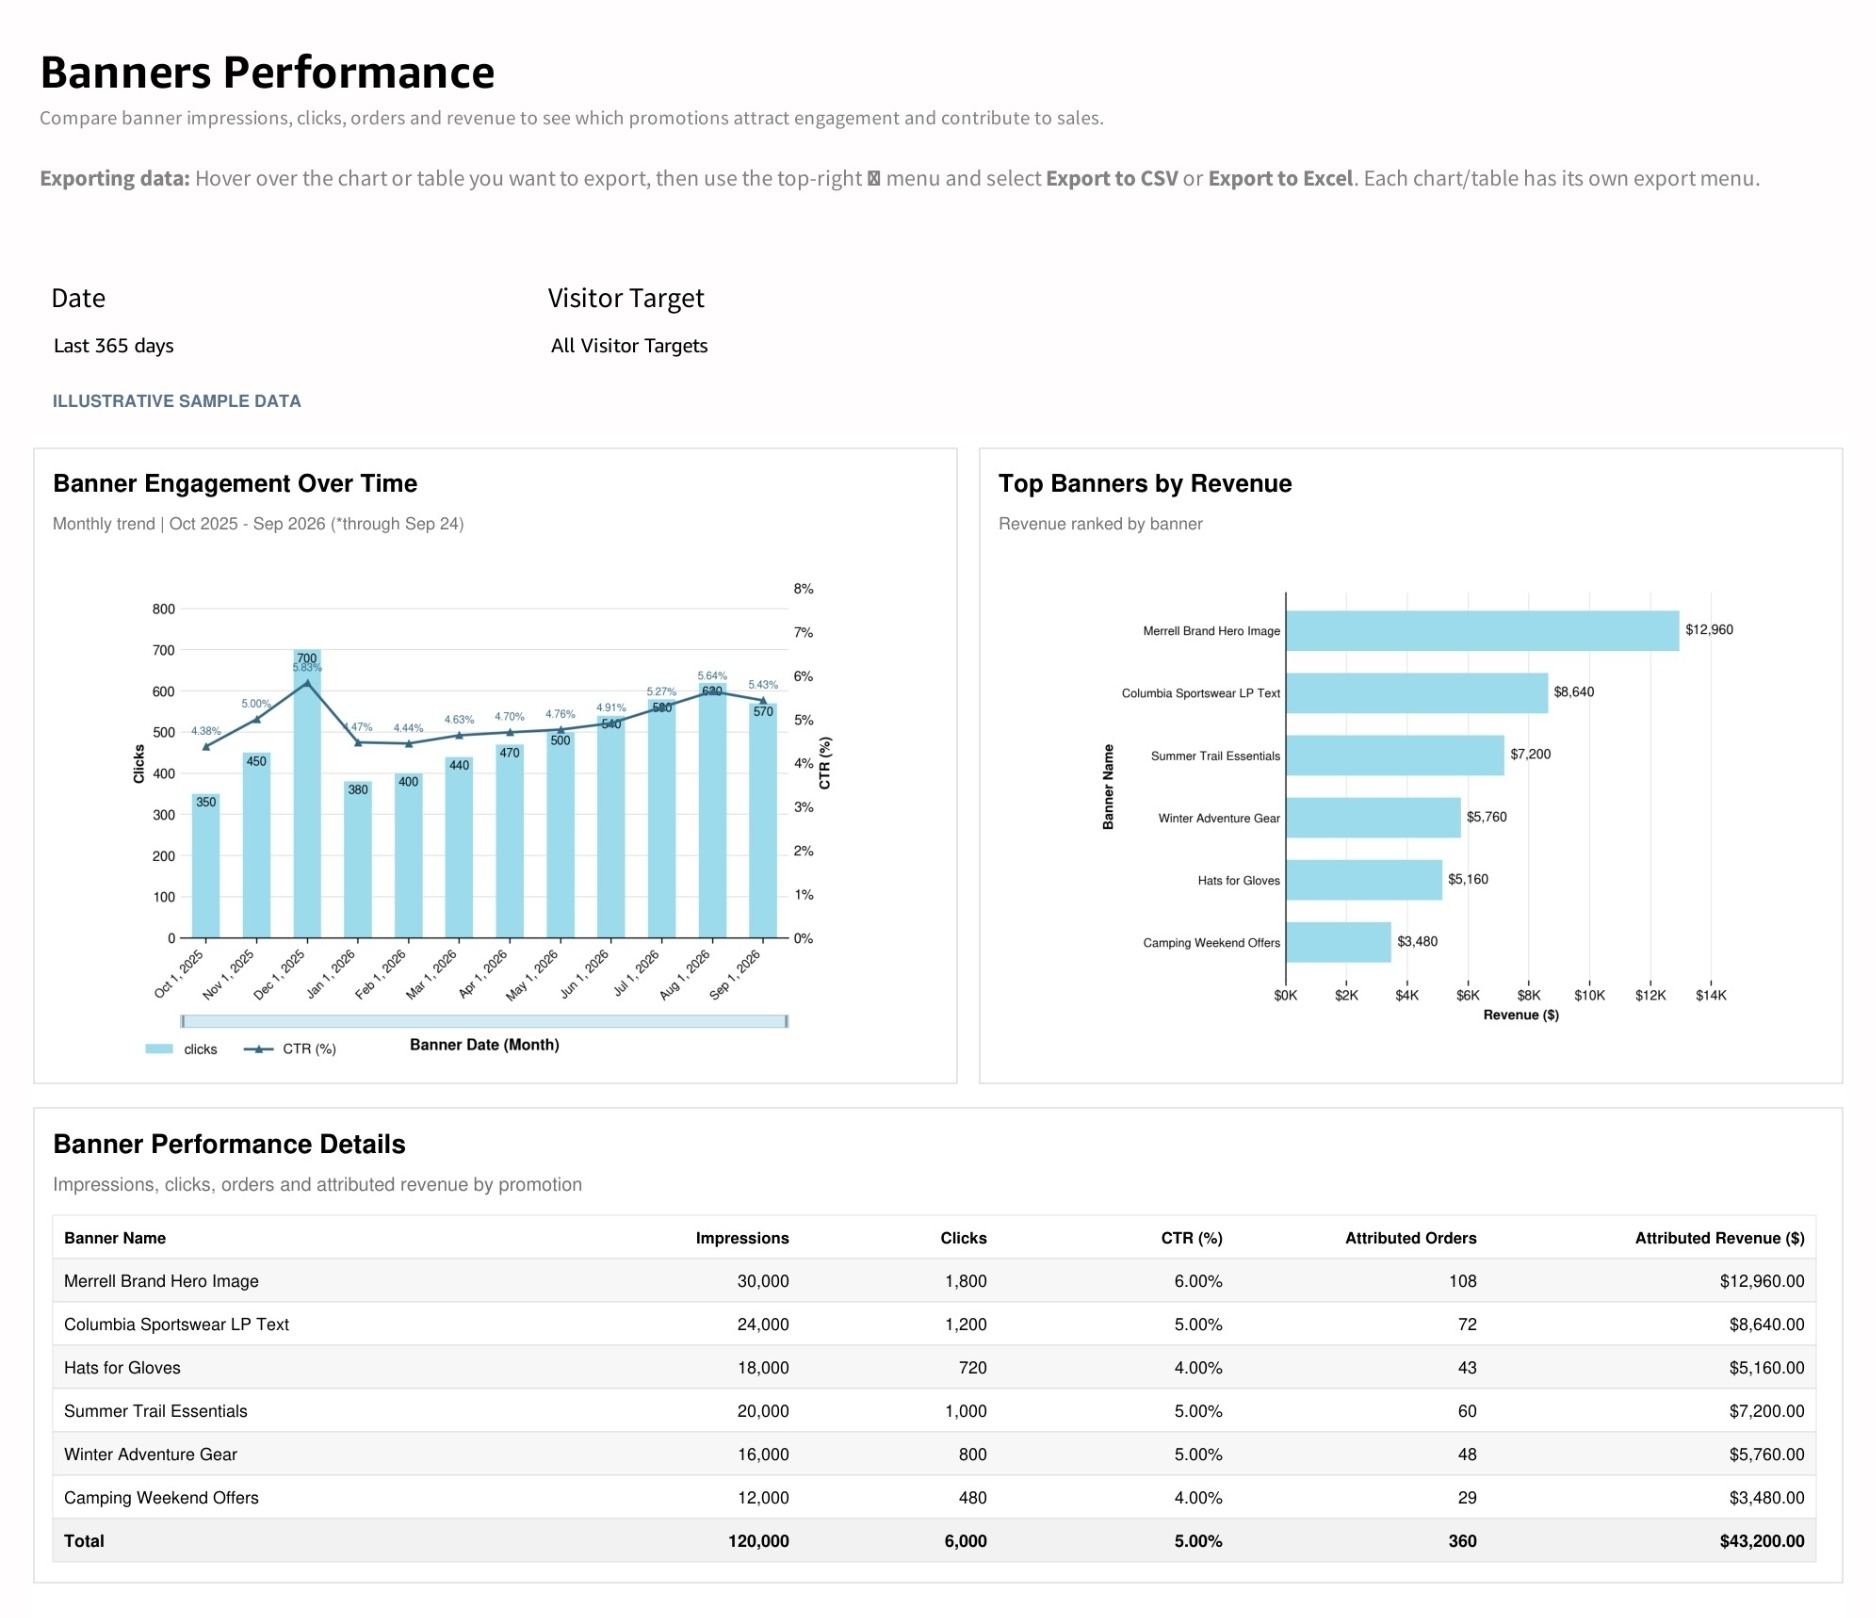
Banners Performance presents engagement and sales-related measures by banner. Use it to review which banner records have recorded impressions, clicks, orders, and revenue in the selected period.
What the report shows
The report contains a banner-level table with the following fields:
| Field | Meaning |
|---|---|
| banner_name | The banner associated with the row. |
| impressions | Recorded displays of the banner. |
| clicks | Recorded banner clicks. |
| order_count | The order-count measure associated with the banner. |
| revenue | The revenue measure associated with the banner. |
How to use the report
- Select a date range relevant to the banners you want to review.
- Narrow the engine, group, or visitor target if needed.
- Compare the impression and click counts across banner rows.
- Review order and revenue values alongside engagement.
- Export the table to discuss performance with the team responsible for banner content and placement.
Interpreting the results
Read order_count and revenue as the measures associated with the banner in this report. Do not assume that banner rows form a distinct, site-wide order or revenue total.
If clicks are present while impressions are zero, investigate tracking and reporting scope before deriving a click-through rate. A missing or zero value alone is not enough to establish that a banner was never seen or produced no customer activity.
Use Campaign Performance when you need campaign-level context and trends. This banner view is a detail table; it should be used for the measures it displays rather than treated as a separate campaign dashboard.
Updated about 20 hours ago