

Visitor Targets
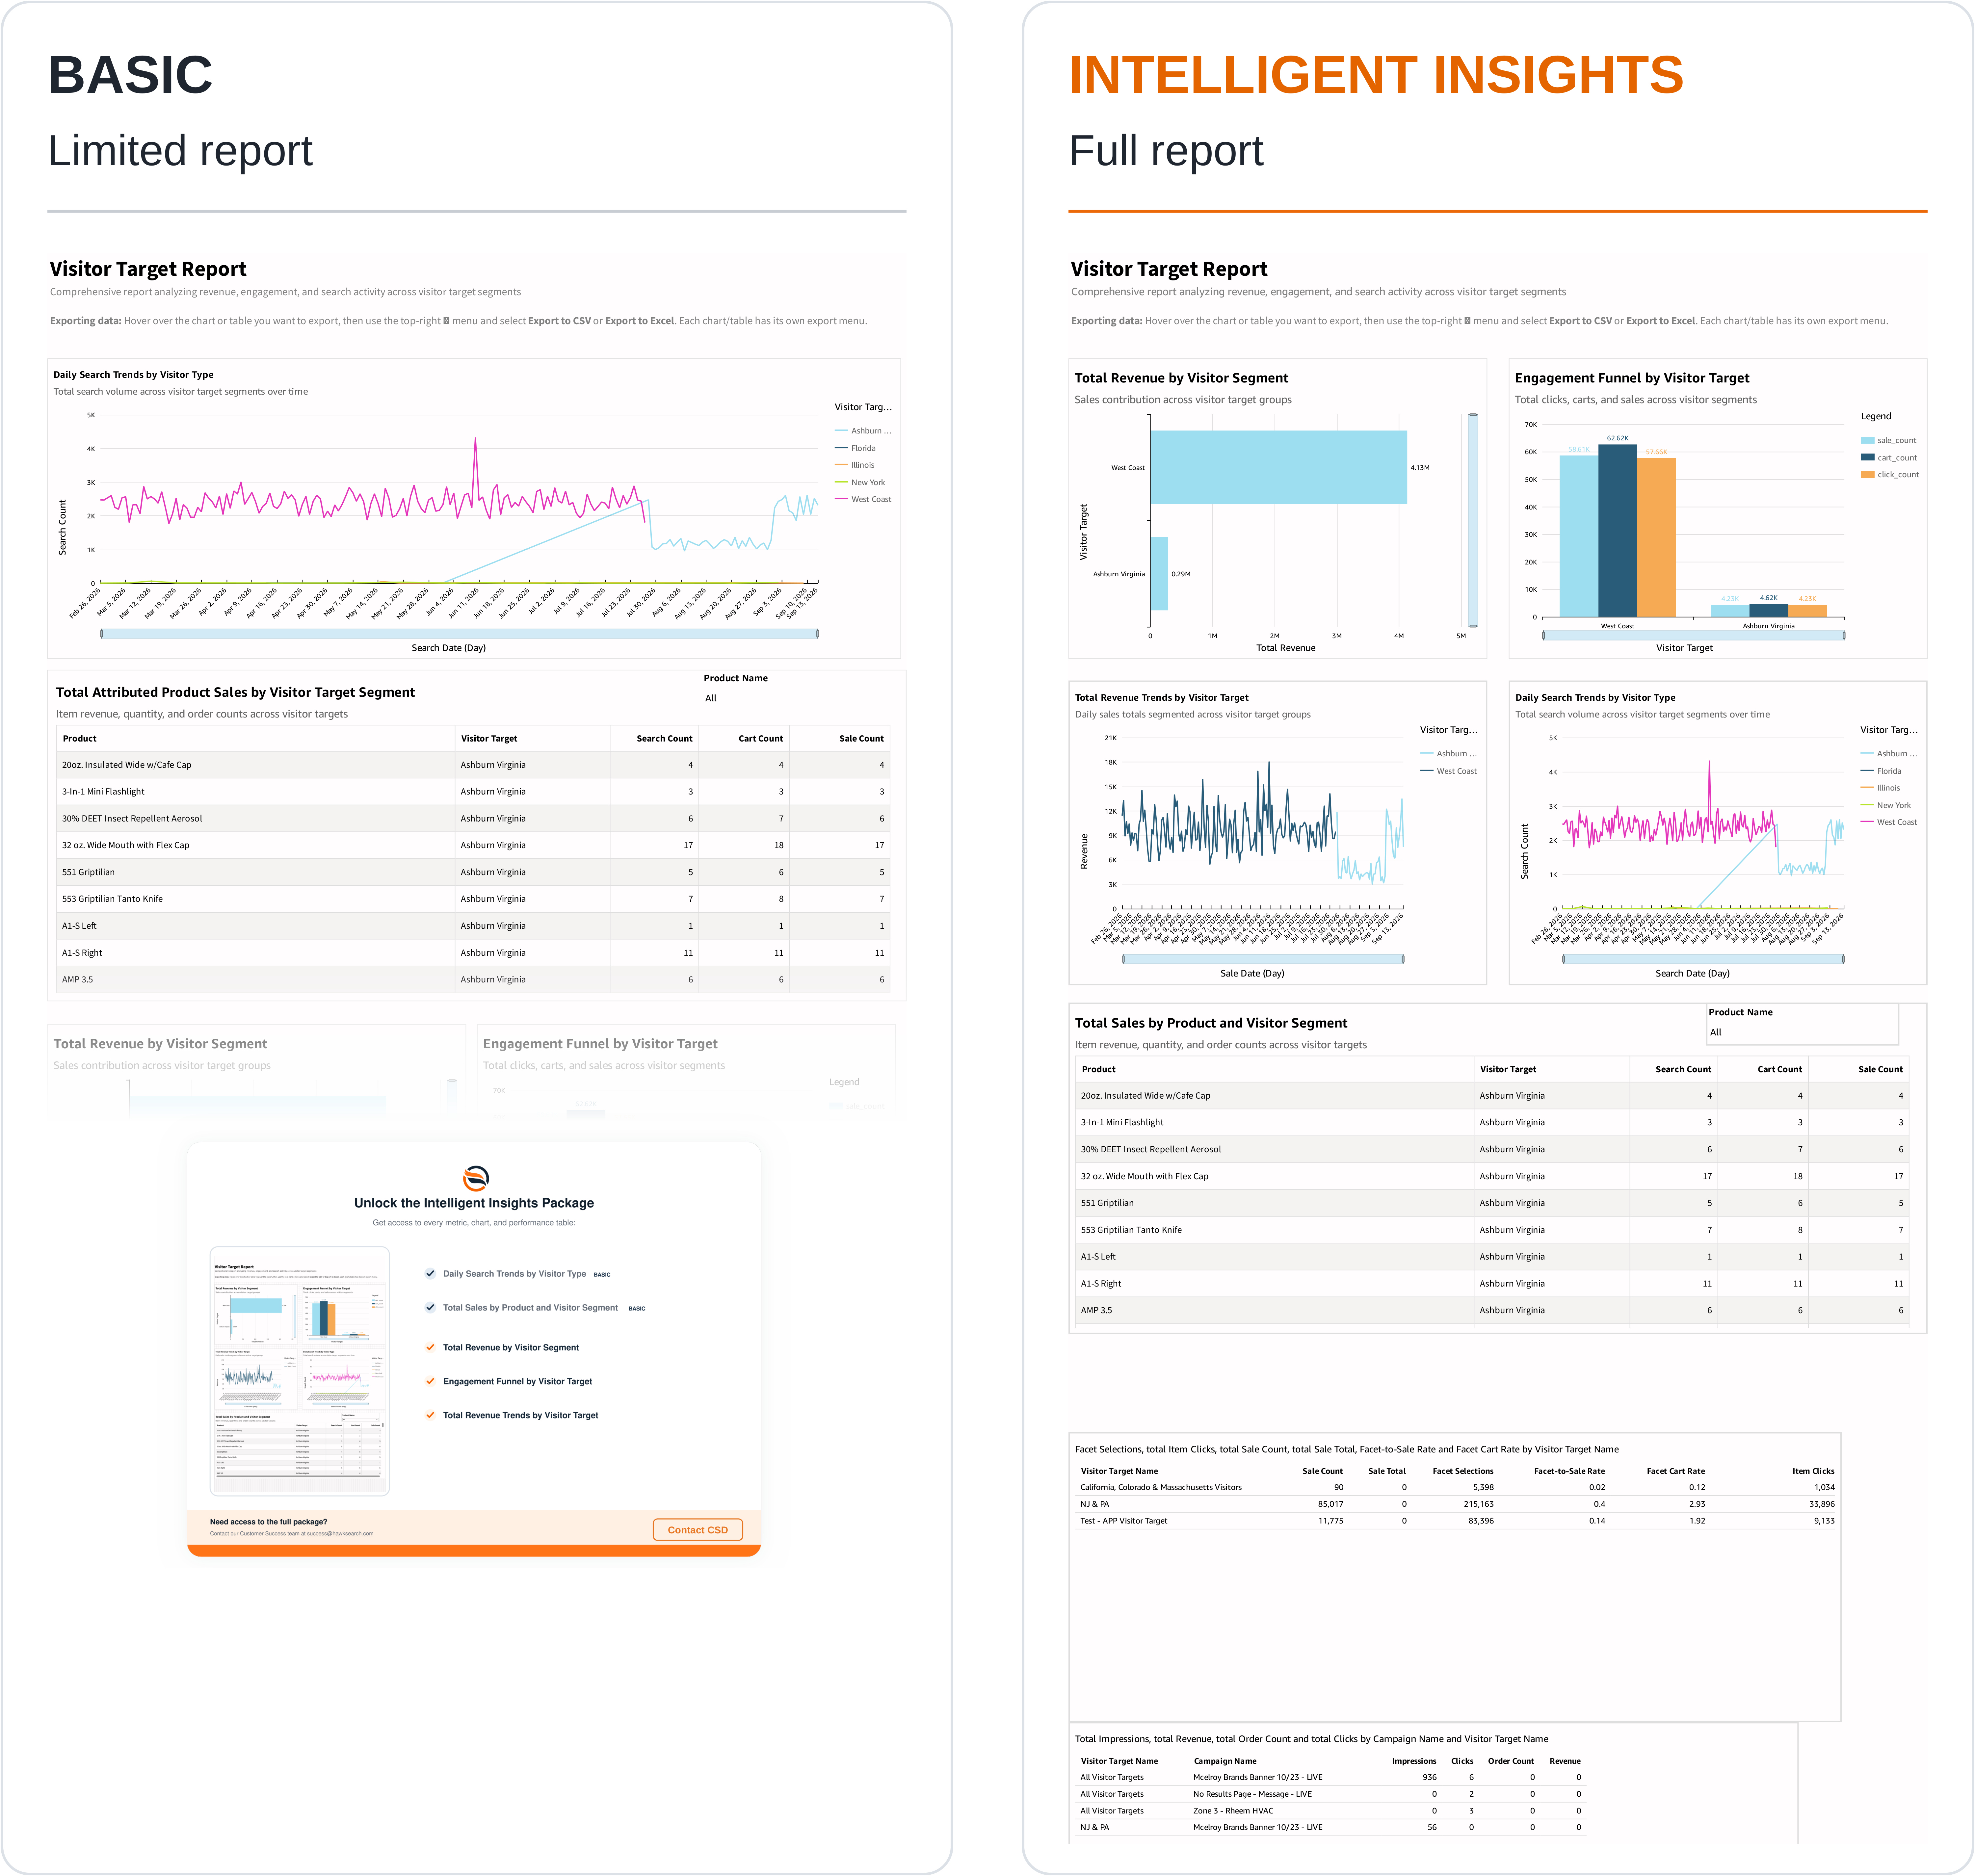
Displayed as Visitor Target Report, this dashboard compares activity across configured visitor segments. Use it to investigate differences in search demand, engagement, sales, facet usage, and campaign activity.
Controls
Use Product Name beside the product table to focus that view. Read the dates on each trend chart and the visitor target labels on each visual before comparing results.
What the report shows
- Total Revenue by Visitor Segment compares reported sales contribution across the segments displayed.
- Engagement Funnel by Visitor Target places click, cart, and sale counts side by side for each segment.
- Total Revenue Trends by Visitor Target shows revenue patterns over time.
- Daily Search Trends by Visitor Type compares search demand over time across the displayed segments.
- Total Sales by Product and Visitor Segment lists product, visitor target, search count, cart count, and sale count.
- The facet table compares Sale Count, Sale Total, Facet Selections, Facet-to-Sale Rate, Facet Cart Rate, and Item Clicks by visitor target.
- The campaign table lists visitor target, campaign, impressions, clicks, order count, and revenue.
How to use the report
- Identify the segment names and periods represented in each visual.
- Compare search trends to understand the demand recorded for each segment.
- Review engagement and sales alongside that demand.
- Select a product to investigate its activity by visitor target.
- Use the facet and campaign tables to identify segment-specific differences worth reviewing in the site experience.
Interpreting the results
Visitor targets represent the segmentation configured for your site. Check what a target means before treating it as a demographic or geographic population.
Do not add named targets and an All Visitor Targets row together. Confirm whether your configured targets overlap before adding their measures at all. Different visuals can also represent different sets of segments or tracking contexts.
The engagement chart compares recorded counts; it should not be assumed to follow one deduplicated group of people through successive stages. Review the rate labels and formats carefully, especially when facet rates appear as decimal values rather than formatted percentages.
Intelligent Insights
Our Intelligent Insights package provides deeper and intuitive insights into your business.
This feature is enabled per request, please reach out to your CSD at [email protected] for more information.
Updated 6 days ago