

Search Performance
Search Performance combines monthly search, engagement, and conversion measures. Use it for recurring performance reviews and to connect headline changes with the keywords contributing to them.
What the report shows
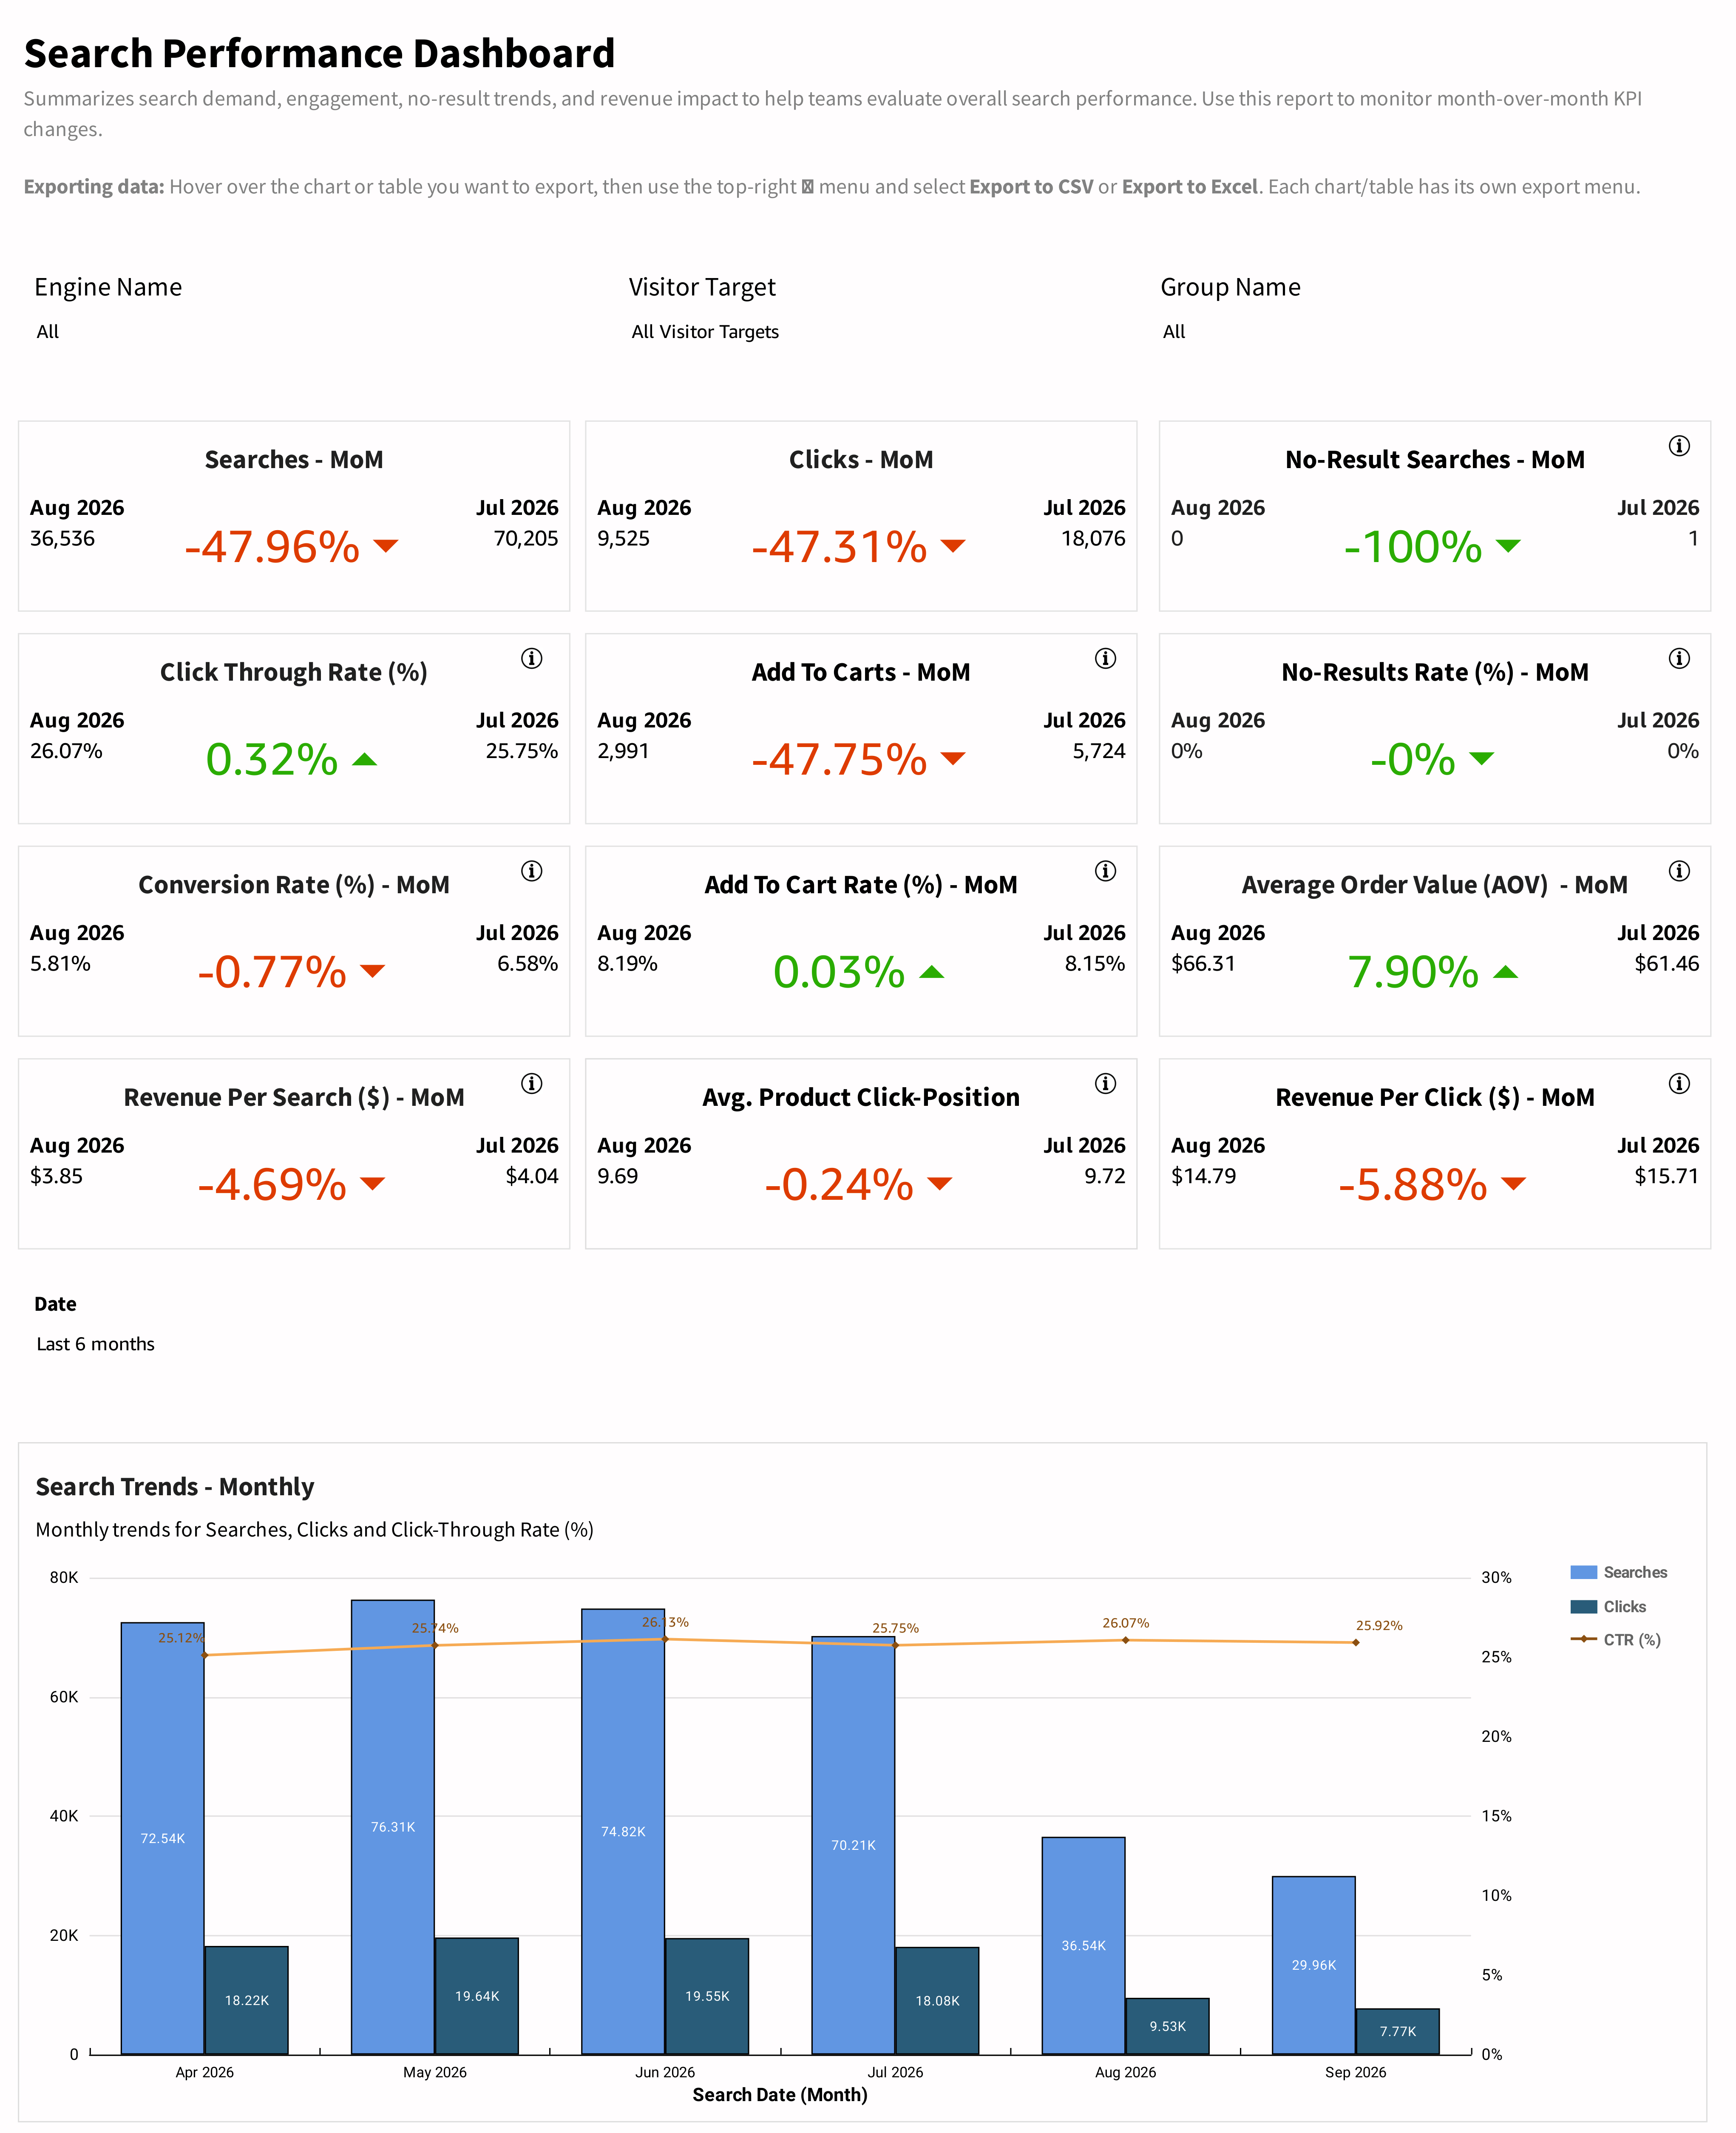
The KPI cards cover searches, clicks, click-through rate, add-to-carts, add-to-cart rate, conversion rate, no-result searches, no-results rate, AOV, revenue per search, revenue per click, and average product click position.
Search Trends - Monthly plots searches and clicks alongside CTR. Top-10 Searched Keywords identifies high-demand terms. The no-results table lists the search term, no-results count, search count, and no-result rate.
Sales By Top-10 Keyword Searches combines searches, clicks, CTR, cart counts, cart rate, attributed sales, keyword-attributed sale value, and cart-to-sale information. Use it to compare demand and downstream activity among the displayed terms.
How to use the report
- Read the KPI period labels and identify which measures changed.
- Compare volume changes with rate changes. Fewer clicks alongside fewer searches can have a different meaning from a decline in click rate.
- Use the monthly trend to place the change in context.
- Review high-volume terms and their cart and sales activity.
- Inspect rows with a positive no-results count, then use Queries with Poor Results or Conversion Tracking for a closer review.
Interpreting the results
Use the values in the no-results table to identify actual zero-result activity; a row's presence alone does not establish that it returned zero results. Check its count and rate.
Keyword sale values are attribution measures. Do not treat their sum as additional revenue on top of Executive Overview. Read rate changes carefully: a displayed difference between two percentages may be a percentage-point change rather than a relative change.
Updated about 4 hours ago