

Executive Overview
Executive Overview brings together the main measures of on-site search performance. Use it to review search-related orders and revenue, spot changes in engagement, and decide which detailed report to open next.
What the report shows
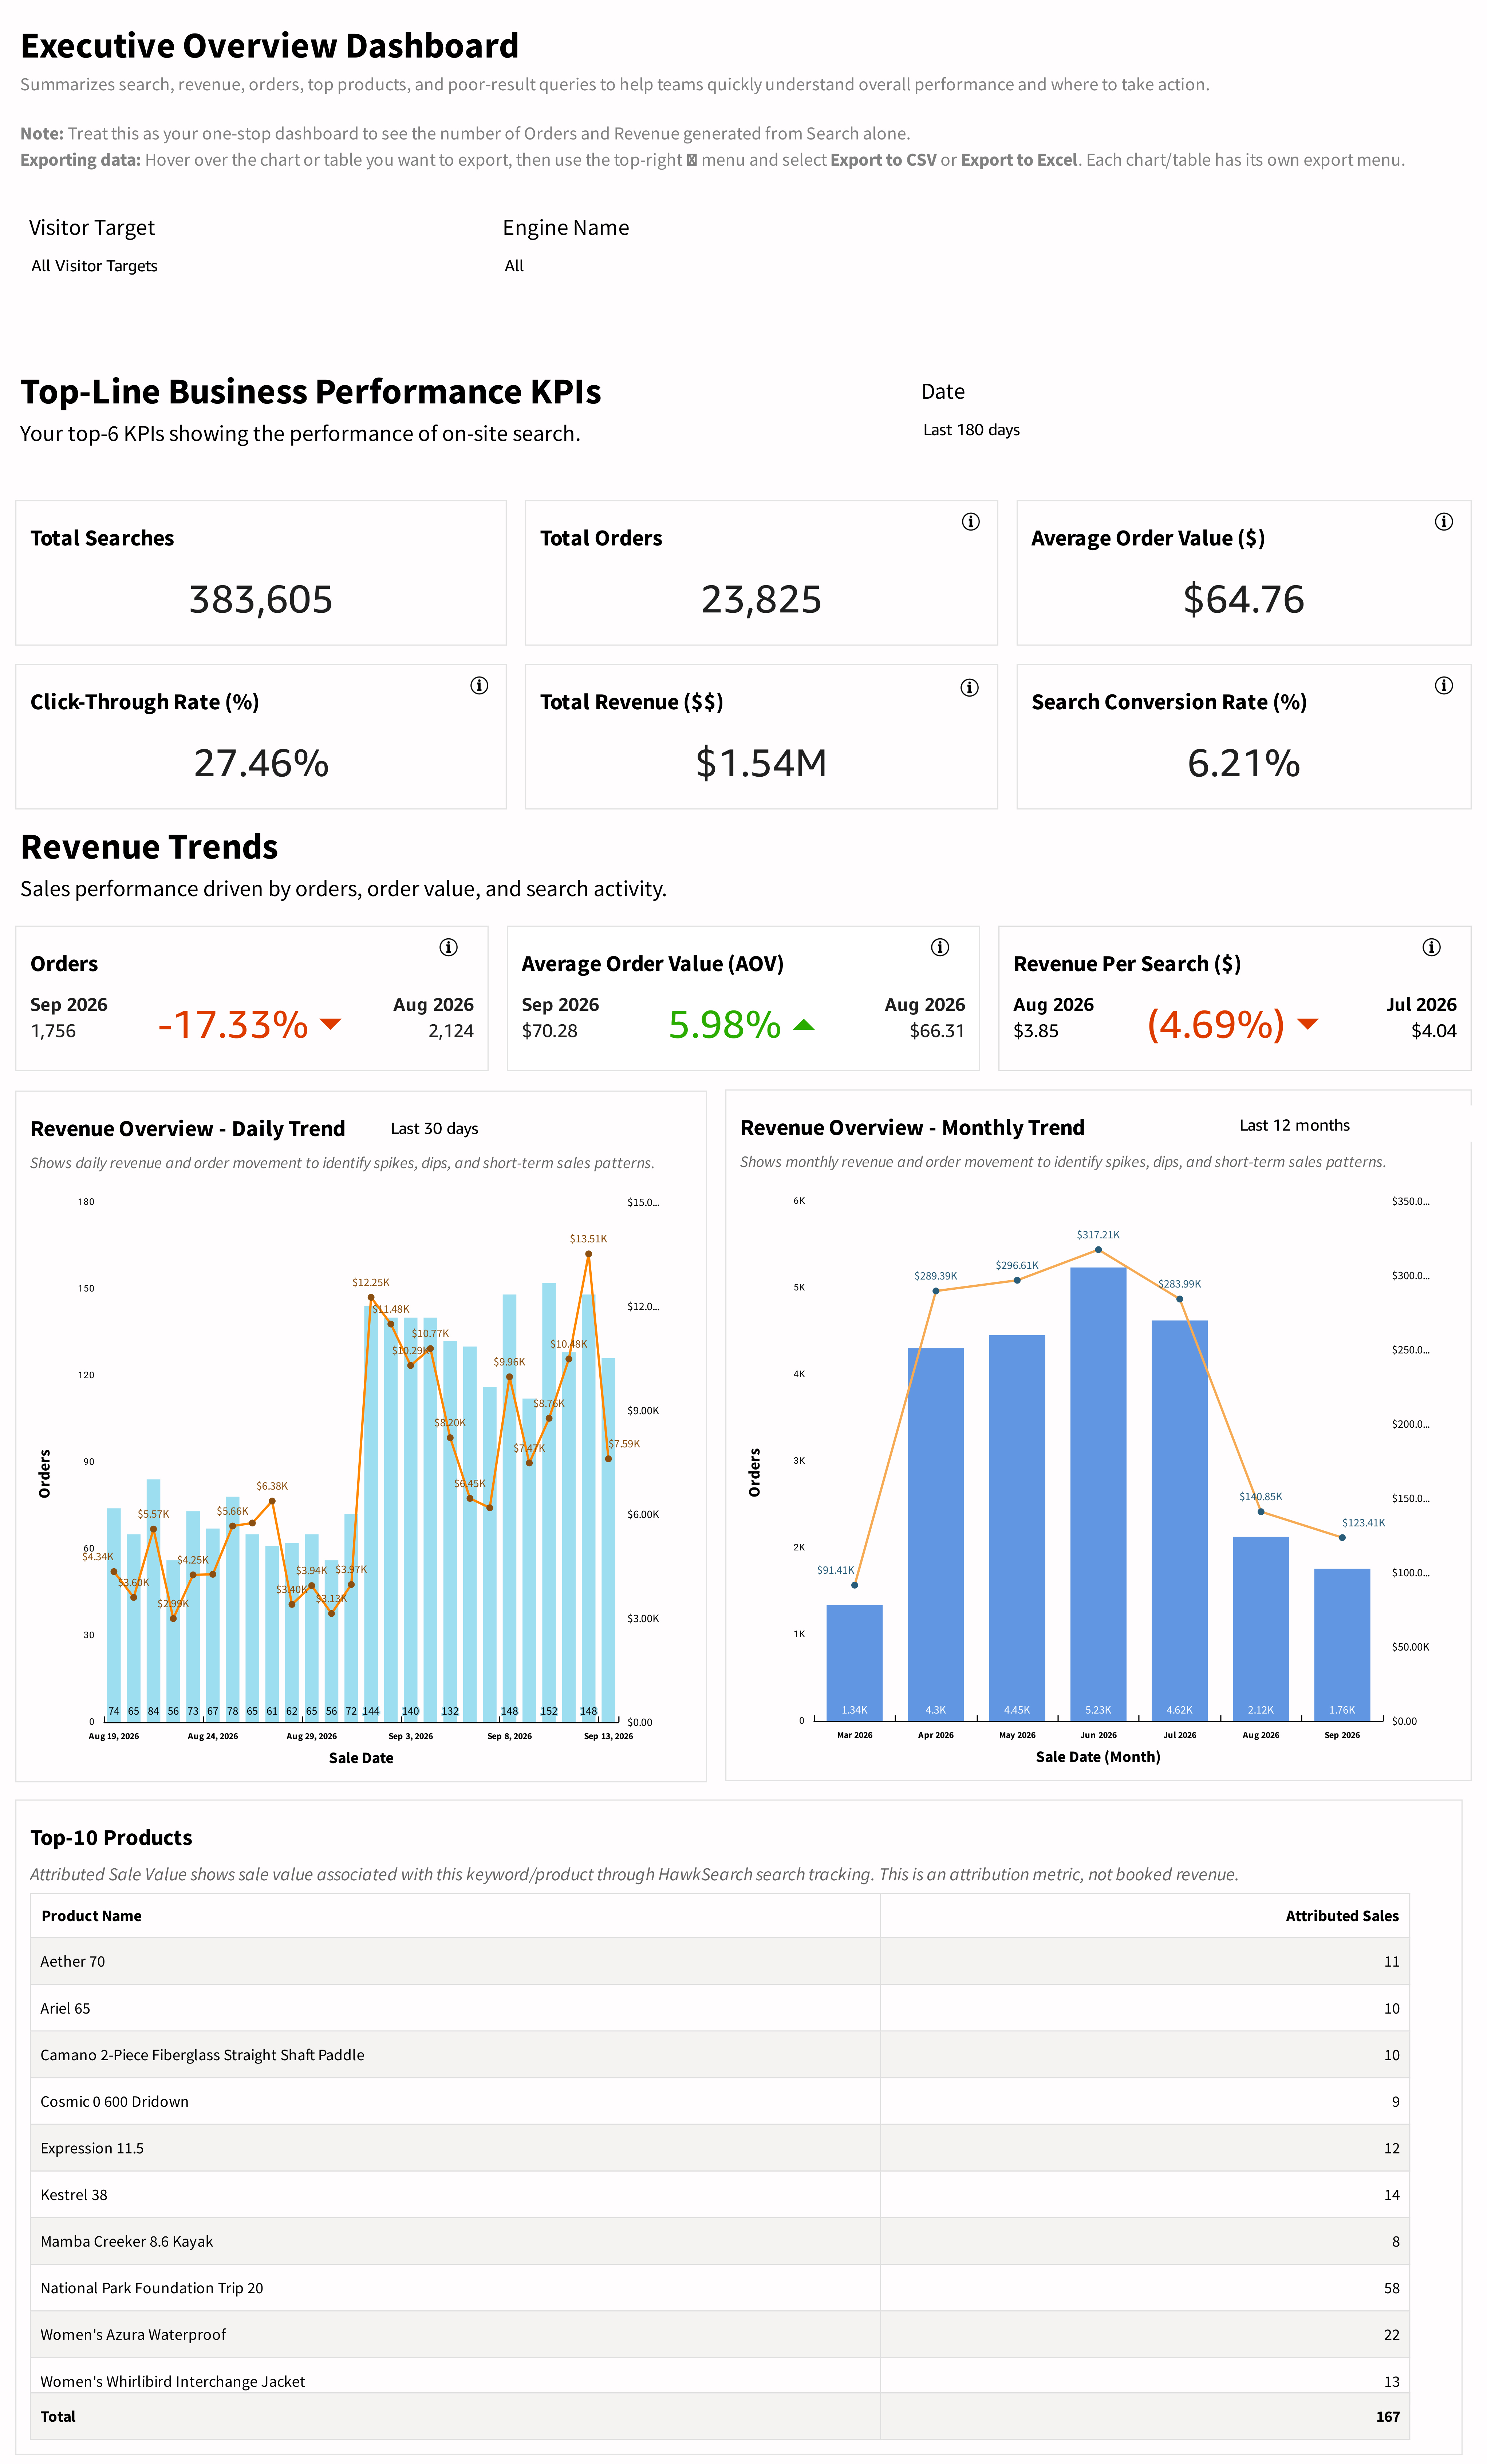
The six top-line KPIs are Total Searches, Total Orders, Average Order Value, Click-Through Rate, Total Revenue, and Search Conversion Rate. Together, they summarize demand, engagement, and the reported sales outcome of search activity.
The Revenue Trends section includes order, AOV, and revenue-per-search comparison cards; a daily chart of orders and revenue; and a monthly chart for longer-term context. The Top-10 Products table lists products with attributed sales activity.
The Search Trends section includes search and click comparison cards, daily search and click trends, the most searched keywords, and queries with poor results. The poor-results view uses the result-count threshold beside that table.
How to use the report
- Choose the engine and visitor target, then check each section's reporting period.
- Review the six KPIs to establish overall search performance.
- Use the revenue charts to distinguish changes in order volume from changes in average order value.
- Compare search and click trends to see whether customer demand and engagement are moving together.
- Open Top Queries for popular terms, Queries with Poor Results for limited-result searches, or Conversion Tracking for keyword and product contribution.
Interpreting the results
Use this report for top-level search-related orders and revenue. The product table contains attribution measures and should be read separately from the headline order total. A rise in revenue can reflect more orders, higher order value, or both; the paired revenue and order charts help separate these effects.
Check the actual periods on comparison cards. The revenue and search cards need not refer to the same month, and a partial current month should not be treated as a completed month.
Updated about 5 hours ago