

Click Position
Displayed as Average Click-Position Report, this report shows where customers click within search results. Use it to identify terms for which customers tend to choose products farther down the result list.
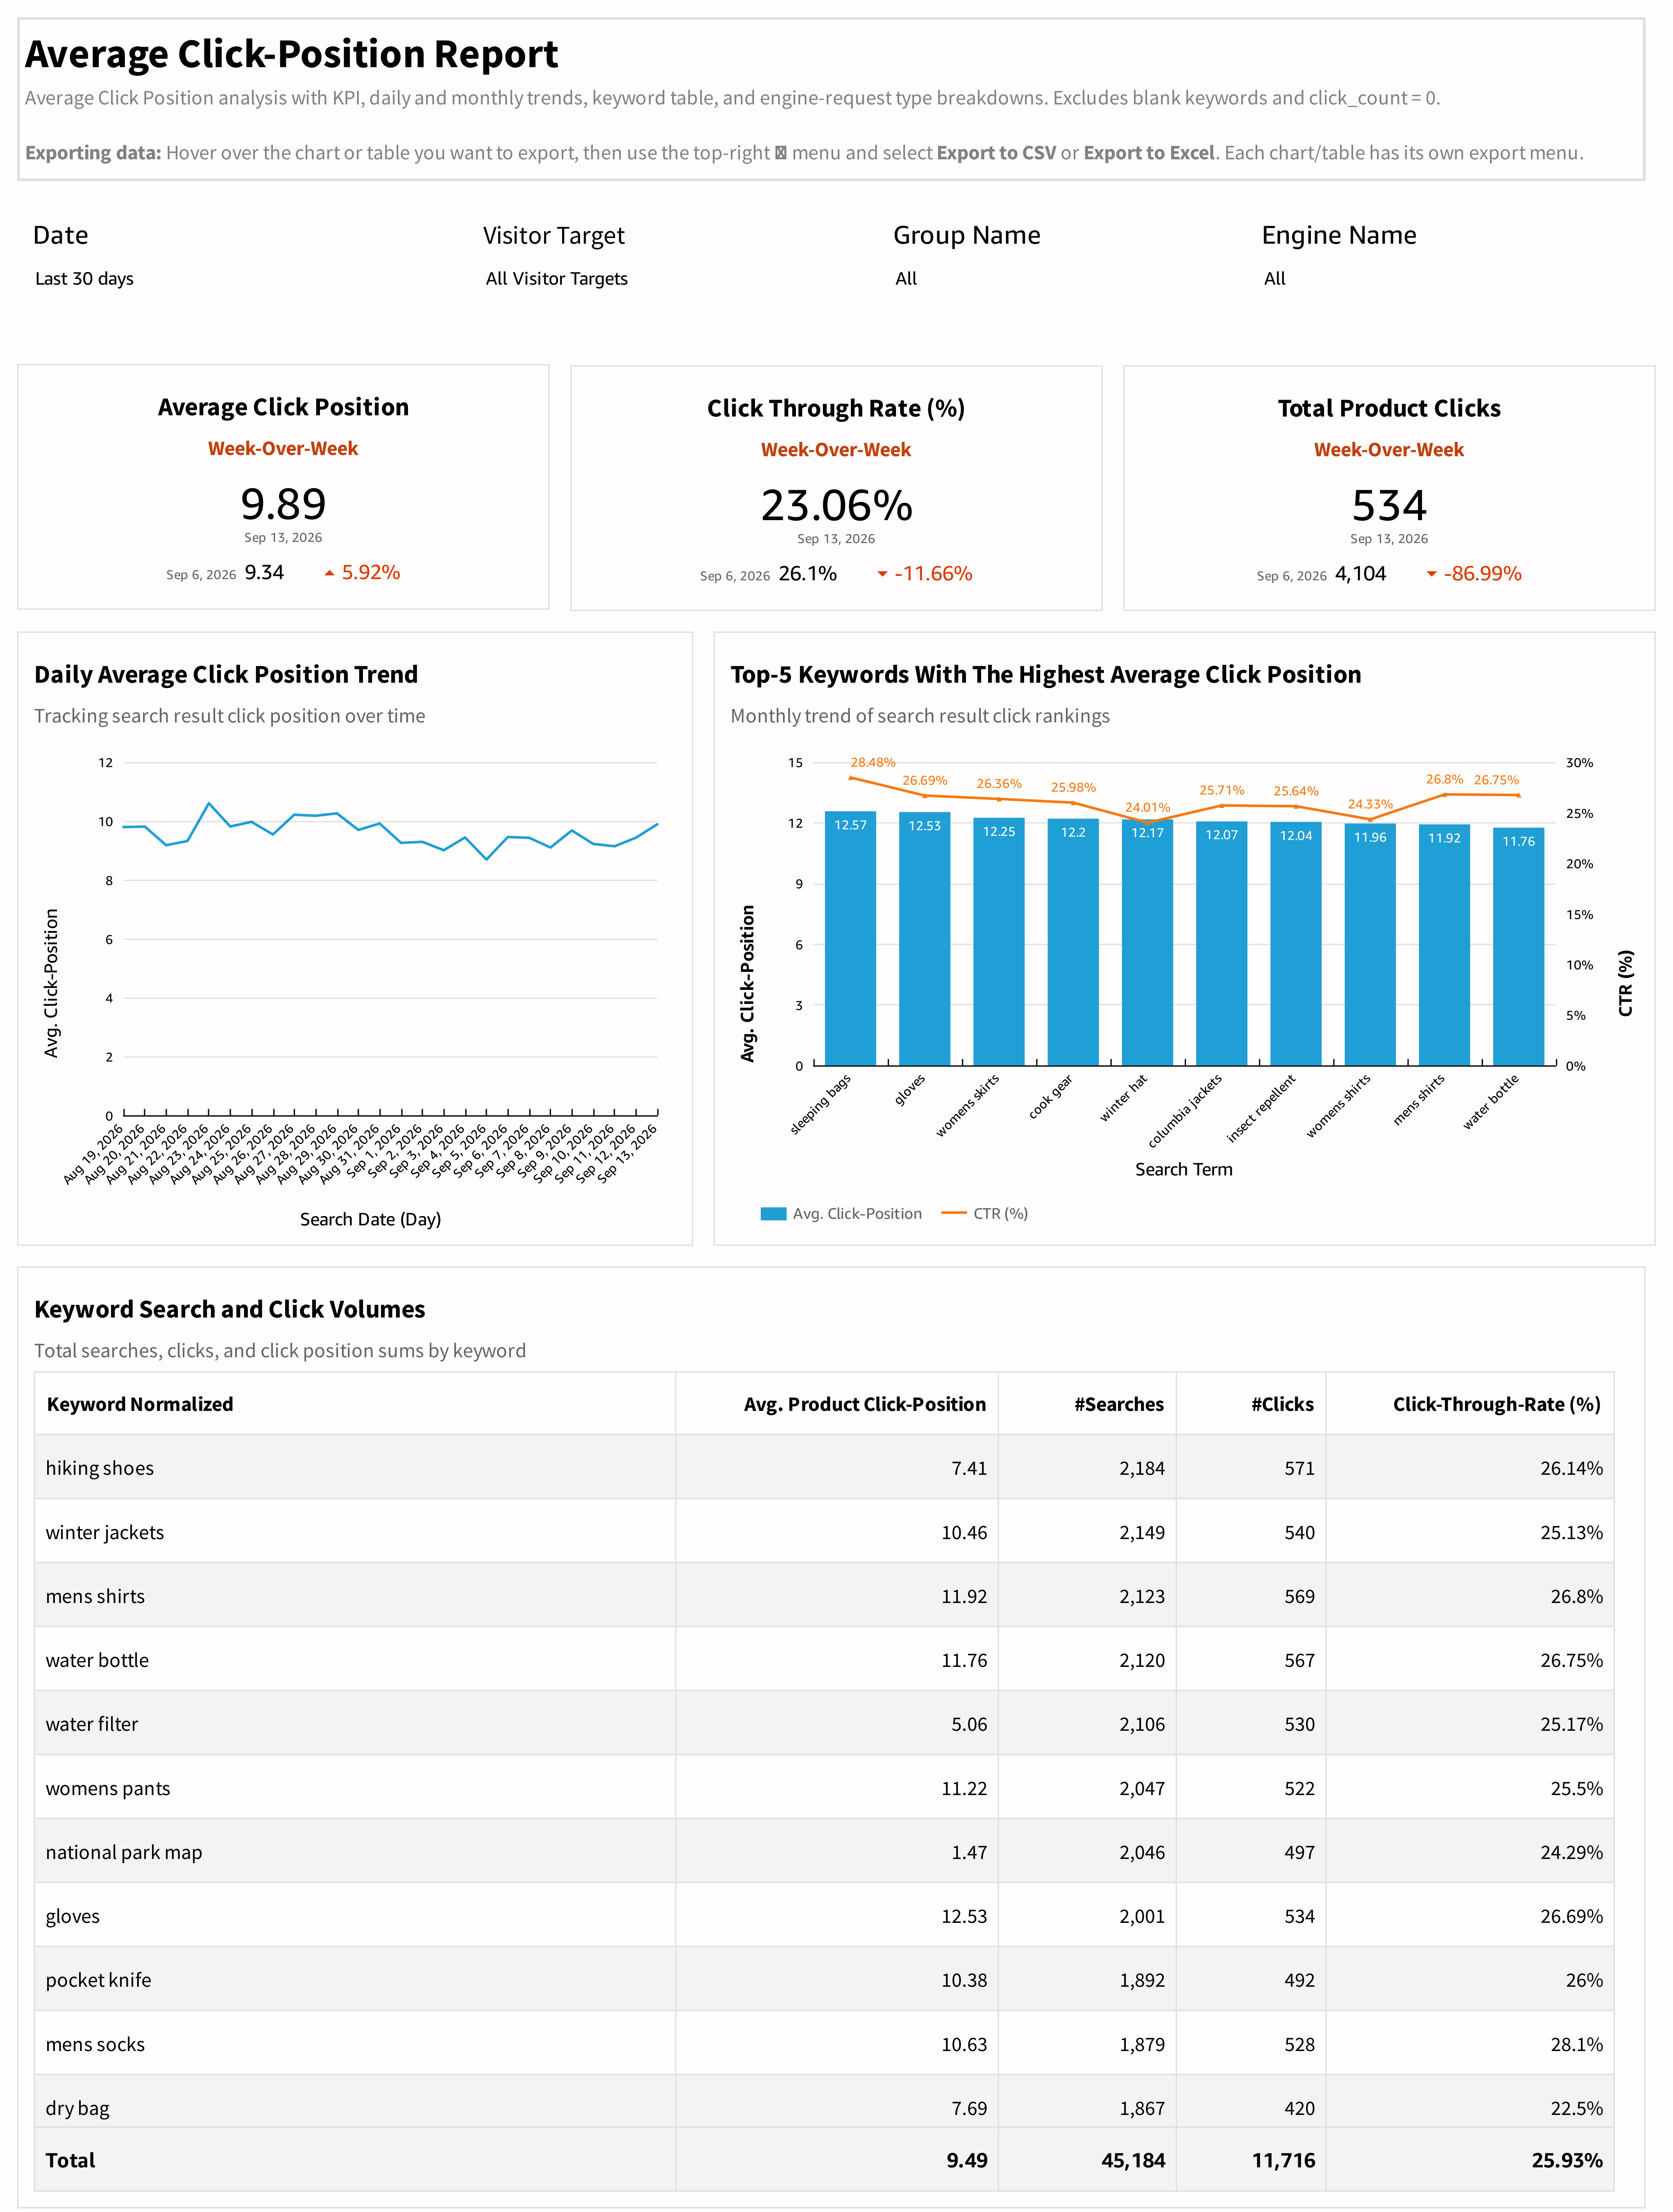
What the report shows
The comparison cards display Average Click Position, Click Through Rate, and Total Product Clicks for the labeled periods.
- Daily Average Click Position Trend shows changes in the recorded positions of clicked results. A keyword comparison chart plots average click position alongside CTR for the displayed terms.
- Keyword Search and Click Volumes contains the normalized keyword, average product click position, search count, click count, and click-through rate. Use this table to assess the significance of a position measure alongside its volume.
How to use the report:
- Select the period and engine or audience.
- Review the daily position trend for a sustained shift.
- Inspect high-volume keywords with larger average position values.
- Search those terms on your site and review which products occupy the earlier positions.
- Use relevance tuning, merchandising, or product content review where the ordering does not match customer intent, then compare a suitable later period.
Interpreting the results:
A smaller position value means clicks occur closer to the start of the results under the report's position convention. A larger value suggests that customers are selecting results farther down. Neither value alone proves that the ranking is good or bad: customers may be browsing deliberately, and the type of query matters.
The report describes searches with recorded clicks. It cannot by itself explain searches that received no clicks. Pair it with Top Queries and Queries with Poor Results to review those experiences, and with Conversion Tracking to understand the sales activity associated with the term.
Updated about 5 hours ago