

Recommendations
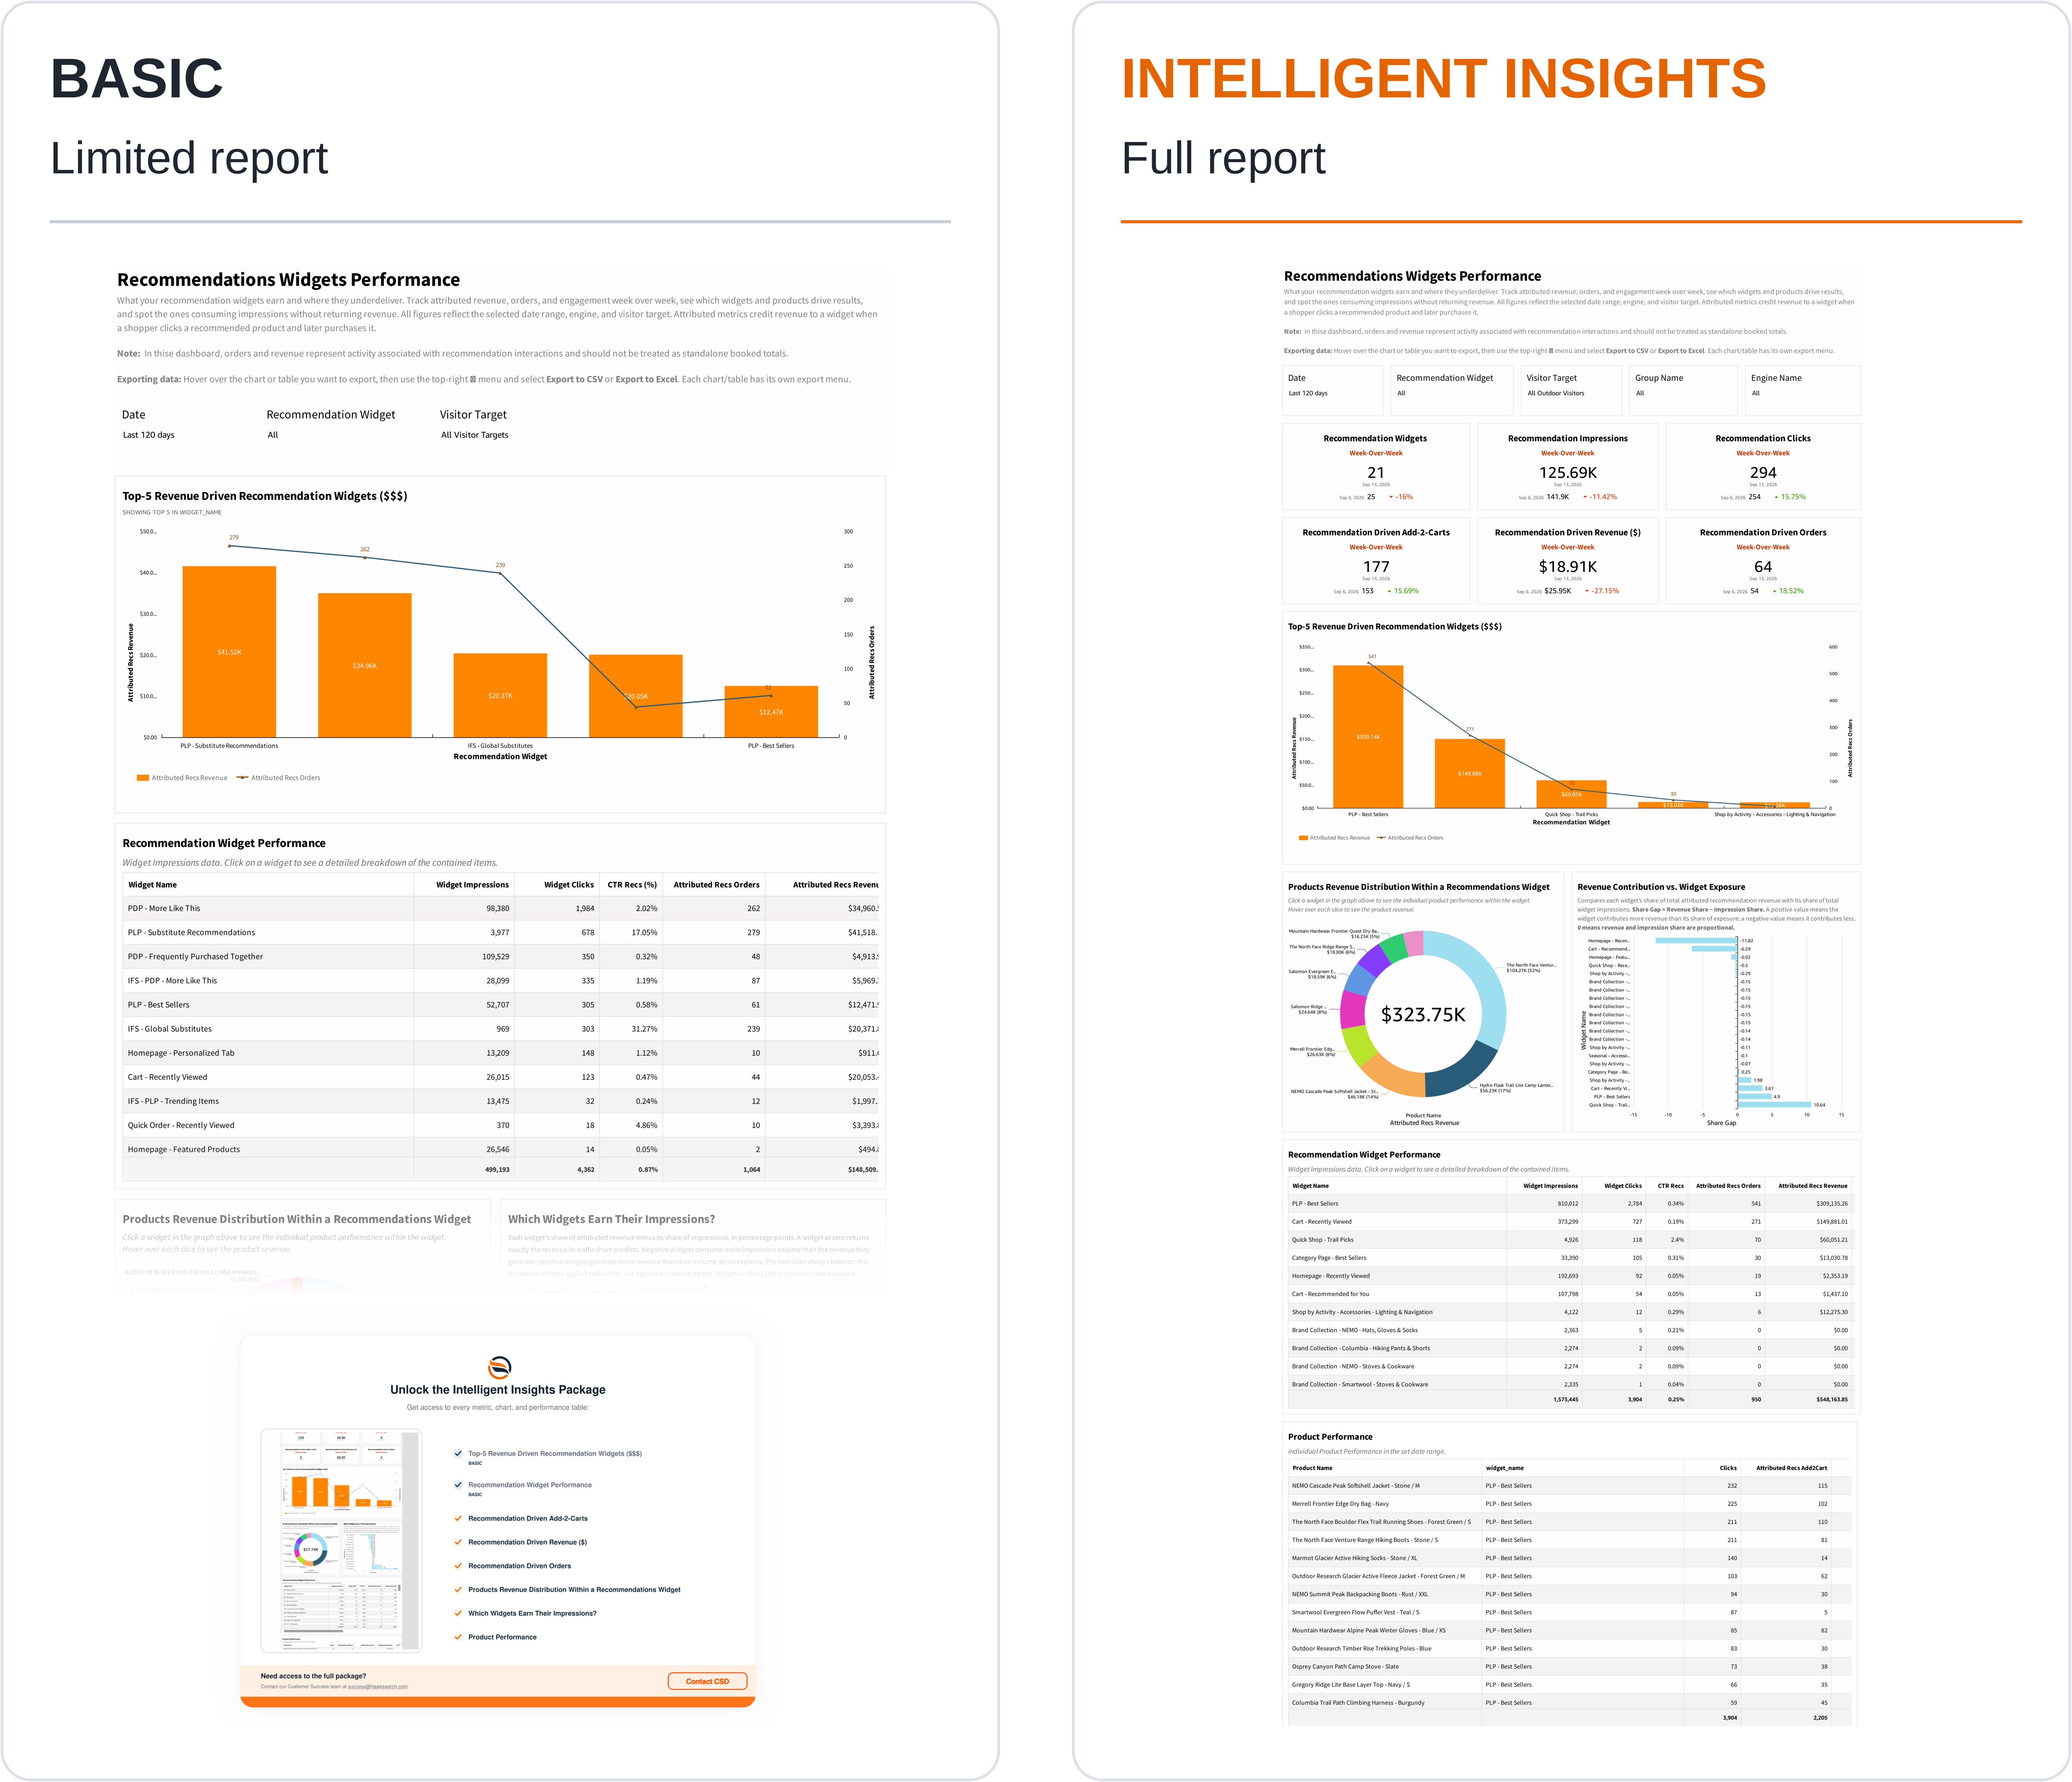
Displayed as Recommendations Widgets Performance, this report compares recommendation widgets and the products customers engage with inside them. Use it to review exposure, clicks, and the orders and revenue associated with recommendation interactions.
What the report shows
The comparison cards cover recommendation widgets, impressions, clicks, attributed add-to-carts, attributed revenue, and attributed orders.
Top-5 Revenue Driven Recommendation Widgets compares attributed revenue with attributed orders. Selecting a widget supports product-level investigation. Products Revenue Distribution Within a Recommendations Widget shows the attributed revenue distribution among displayed products; hover over a slice for product revenue.
Revenue Contribution vs. Widget Exposure compares a widget's share of attributed recommendation revenue with its share of impressions. Share Gap = Revenue Share - Impression Share. A positive gap means its revenue contribution exceeds its share of exposure; a negative gap means the reverse. When both shares are percentages, the gap is measured in percentage points.
Recommendation Widget Performance lists widget impressions, clicks, CTR, attributed orders, and attributed revenue. Select a widget to review the contained products. Product Performance lists product clicks and attributed cart, order, and revenue activity.
How to use the report
- Set the period and engine or audience.
- Compare widgets using exposure, engagement, and attributed revenue together.
- Inspect widgets with a negative share gap, then check their purpose and placement.
- Select a widget and review its product distribution and product performance.
- Investigate product selection, stock availability, placement, or recommendation strategy where exposure does not produce useful engagement.
Interpreting the results
The dashboard describes attribution to a widget when a shopper clicks a recommended product and later purchases it. Attributed orders and revenue describe associated activity and should not be treated as standalone booked totals or added to search revenue.
A share gap is a prioritization aid, not a causal measure of a widget's value. A widget can serve a different stage of the journey or a different audience. Check total volume as well as the gap, and do not interpret a share comparison normally when its underlying total is zero.
Intelligent Insights
Our Intelligent Insights package provides deeper and intuitive insights into your business.
This feature is enabled per request, please reach out to your CSD at [email protected] for more information.
Updated 17 days ago